It’s time to pay attention to commodities. The 10-year rolling return from commodities is negative 7.2 percent, the worst since the 1930s. The long-run relative price of real assets to financial assets is currently at its lowest level since 1926.
To dig deeper, we gathered our community of commodity experts for a focused discussion. Each participant shared a chart to discuss with the group. Please find herein a review of the charts and conversation.
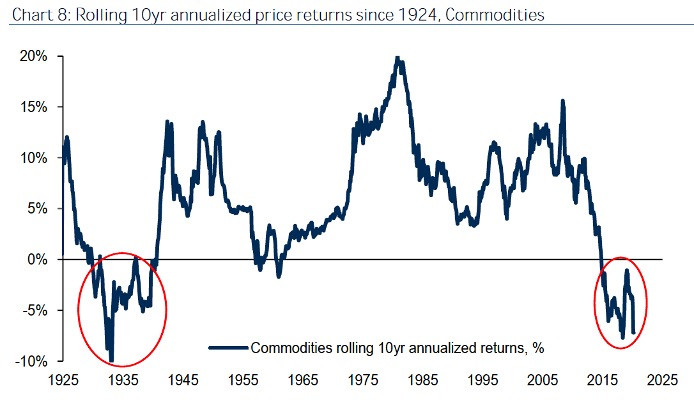
Source: Bank of America Merrill Lynch
Chart 1: The Magic Number “Commodity markets have never been so interesting in my career.”
Chart 2: Energy Outlook The big question is how much oil production from US shale fields will plummet.
Chart 3: Burn Baby Burn, Climate Inferno The road to hell is paved with good intentions.
Chart 4: Reap What You Sow The first sign of a bull market in grains would be for acres to become unviable—and that hasn’t happened.
Chart 5: The Great Speculation Bitcoin’s scarcity and teleportability make it an essential asset to own in current times.
Chart 6: Space Economy The launch heralds the beginning of profit-driven human space exploration and a new space race.
Chart 7: Bullish Case for Natural Gas The Speaker expects natural gas price to double by the end of the year.
Chart 8: Nuclear Option “Uranium is in a bull market.”

Photo: Shutterstock