Visualize, if you will, an investment committee discussing markets and economic trends sitting around a table or virtually over Zoom. Suppose a contrary fellow asks: “What if the stock market crash this year was an intervening cyclical top within a contrasting secular trend? Have you thought about that?”
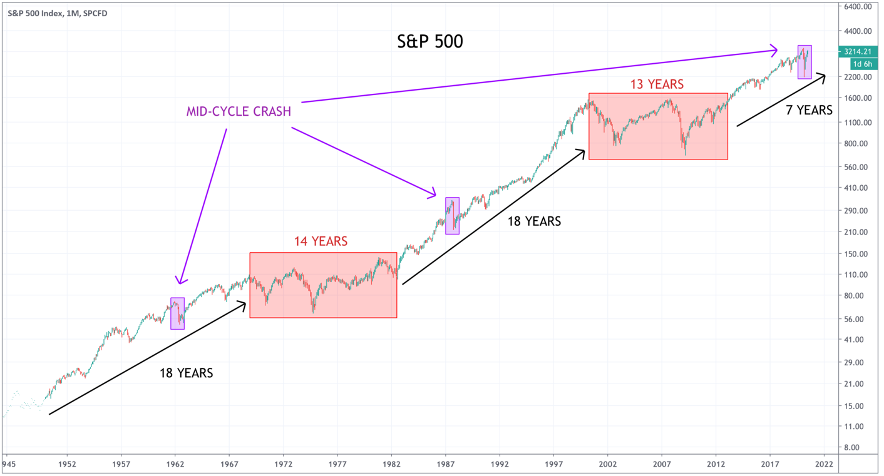
Secular bull and bear markets reflect long-term trends in societal attitudes, evident in the level of risk people are willing to take. Since the Second World War, there have been three secular bull cycles with numerous cyclical trends occurring in between.
The first was from 1950 to 1968. The S&P 500 rose from 20 to 109 for a gain of 440 percent. But twelve years into the secular bull market, there was a violent correction.
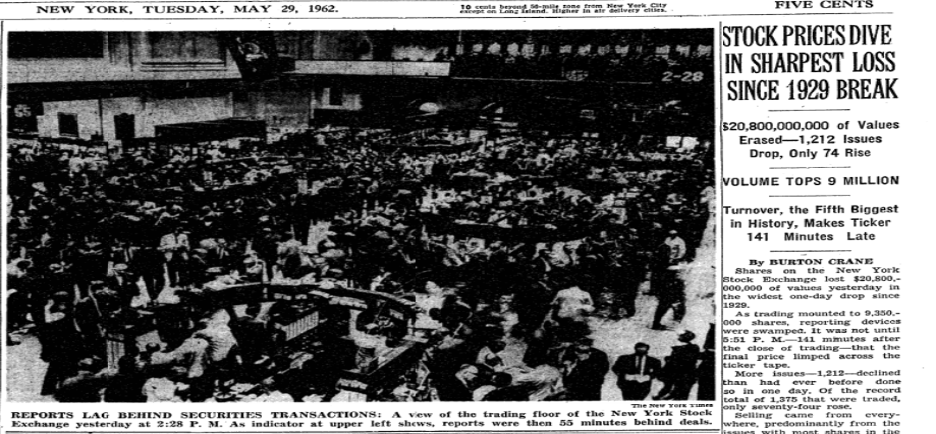
In 1961, stocks had risen 27 percent, with leading technology stocks like Texas Instruments and Polaroid trading at up to 115 times earnings. And then, stocks “broke,” as The Wall Street Journal described it, seemingly out of the blue.
On May 28, 1962, the S&P 500 plunged 6.7 percent. The flash crash left traders shaken and exhausted. It was the worst decline since 1929.
Journalists turned to Warren Buffett to figure out what happened. “There was some forced selling by margin calls from brokers which created self-generating mechanism on the downside,” Buffett said, “which we may have seen the last of and we may have not seen the last of.”
The S&P 500 fell about 30 percent in six months. IBM fell from $607 to $355.
On June 19, the New York Herald Tribune wrote: “The experts have been confounded and there’s not an unshattered crystal ball left in Washington.”
Investors bombarded the White House with complaints and pleas for help. There was a “general public disenchantment with the market,” the Securities and Exchange Commission reported in its investigation. Households slashed their purchases of stocks while 8 percent of stockbrokers left the business in 1962.
Oil tycoon J.P. Getty addressed the press, “When some folks see others selling, they automatically follow suit. I do the reverse—and buy. I don’t think the slide will go on.”
With the backing of successful investors, the public’s fears subsided. The stock market bottomed on June 25 and recovered its prior peak fourteen months later. The S&P 500 doubled over the next six years.
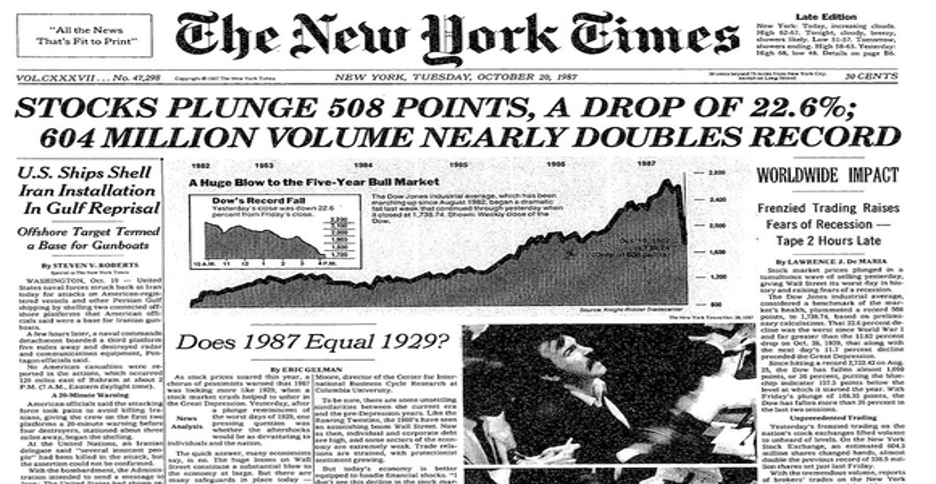
The next secular bull market took place from 1982 to 2000. The S&P 500 rose from 120 to 1,500 for a gain of 1,150 percent. The crash of 1987 occurred five years in, the largest one-day percentage drop in US stock market history.
On October 19, 1987, the stock market collapsed under a selling avalanche of more than half a billion shares that would have normally taken a year of trading to reach. Forced selling from the margin calls of risk arbitrage players took the market down to the “trigger levels” for the portfolio insurance holders who then began selling futures which exacerbated the selloff.
Individual investors frantically called their mutual funds to redeem shares which led to more selling pressure. The S&P 500 plunged more than 20 percent on Black Monday. Nasdaq only fell 11 percent because the market system failed under the deluge of sell orders. Paul Tudor Jones, who profited on the day, said Wall Street was dealt a “life-threatening blow.”b>The panic spread worldwide with losses estimated at $1.7 trillion.
“People are scared to death,” said Hugh Johnson, analyst at First Albany Corp. Susan Grossman, a well-respected broker, proclaimed, “The bull market is history.” The S&P 500 had fallen 35 percent in 4 months. Many thought the crash was the start of another depression, including Jones who founded Robin Hood Foundation because of his concern for the poor.
But prices rebounded the next day, and by the end of 1987 the stock market was higher than it had been at the start of the year. Contrary to popular perceptions, the S&P 500 returned to its pre-Black Monday level just two years after the crash. It went on to rally for another thirteen years.
The third secular bull market in the postwar era began in 2013. Stocks convincingly broke out to new all-time highs after the worst calendar decade for history in stocks (2000-2010). The S&P 500 has risen from 1,500 to 3,270 so far, for a gain of 118 percent.
This time the crash happened seven years in. The S&P 500 fell 12 percent on March 16, the second-biggest one-day fall in history. Market depth virtually disappeared. The VIX index blew out to 83. Less than 4 percent of stocks were trading above their 200-day moving average.
By March 23, the S&P 500 was down 35 percent from its peak. This was the fastest bear market ever. But then, contrary to everyone’s thinking, the stock market erased all of its losses over the next 45 days.
No one believed that stocks may have just entered a new bull market. Second quarter GDP plunged 32.9 percent, the worst ever, and unemployment rose to the highest level since the Great Depression.
If 2020 is an intervening cyclical top within a contrasting secular trend, like in 1962 and 1987, the bull market has years to run. The path is likely to be messier and confusing, but we think the S&P 500 could easily rally to 5,000.
This is not a time to make brave predictions of things to come. But thinking through the “opposites” we can guess what might be coming next. At least, we can fortify ourselves against the unexpected.
Onwards and upwards.