A 1.5 percent yield on the 10-year Treasury in a time of rapidly accelerating inflation. Is there anything more perplexing?
Consumer prices increased by only 1.4 percent in January compared to the previous year; the March and April climbs were 2.6 percent and 4.9 percent, respectively. Over the summer the headline rate jumped to 5.4 percent, and it’s now at 6.2 percent, the highest in three decades. At 12.1 percent, producer price inflation is at a four-decade high.
Feeling lost, confused, and uncertain is as much a hallmark of investing as is clarity, conviction, and a sense of calm. Because we’re all searching for answers, we have nothing to offer except our own confusion.
Bond yields, according to popular belief, should rise and fall in lockstep with nominal growth. That, however, is not consistent with history. They almost never match, especially around major economic cataclysms.
Long-term Treasury yields were persistently below nominal growth from the 1950s to the 1970s. Following the inflation panic, bond yields generally exceeded nominal growth throughout the 1980s and early 1990s. Bond yields have stayed mainly below nominal growth since 2000 as deflationary forces have built up.
The Center on Budget and Policy studied 223 years of data and discovered that nominal growth has largely outpaced bond yields, and by wide margins in recent decades. Here’s how often economic growth has exceeded long-term Treasury yields, and by how much
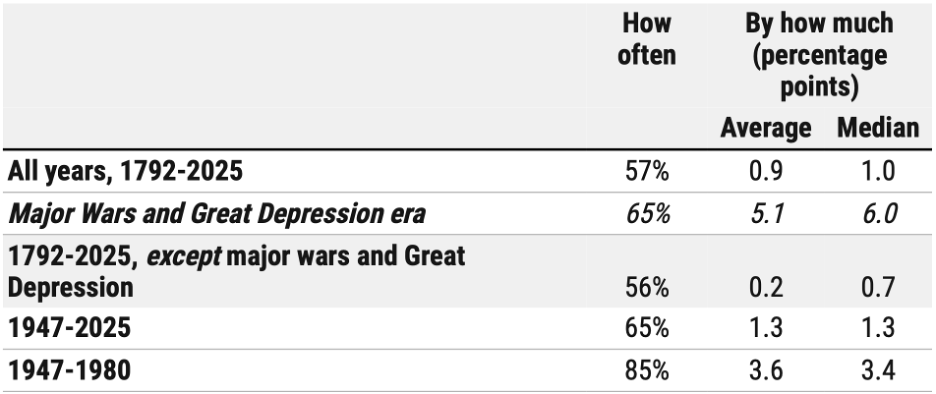
Source: Center on Budget and Policy
During the War of 1812, the Civil War, and the two World Wars, nominal growth exceeded long-term Treasury yields by an average of 12.4 percent. Major wars necessitate substantial increases in government spending, which results in rapid, albeit temporary, boosts in economic growth.
The New Deal programs, which were put in place in 1933 to combat the Great Depression, underpinned a rapid economic recovery. From 1934 to 1938, nominal growth exceeded bond yields by an average of 6.5 percent.
Our situation becomes less perplexing through this prism.
In response to the pandemic-induced economic destruction, the US deficit grew more in three months in 2020 than it did in the previous five recessions combined—1973, 1982, the early 1990s, the dotcom bust, and 2008. With nominal growth running at 10 percent in 2021, the fastest pace in nearly four decades, the gap with bond yields is 8 percent.
When nominal GDP growth exceeds the nominal interest rate (long-term Treasury yield), the government can run modest primary deficits and endure a stable or falling debt ratio. Because the weight of existing debt diminishes over time, policymakers should have an easier job restoring the country’s fiscal health.
This analysis sends a clear message: bond yields will remain below nominal growth for the foreseeable future. The question is where will US trend growth settle once the stimulus fades away?
There are only two ways to grow an economy: increase the number of workers (or, more accurately, the aggregate number of hours worked) or improve labor productivity (output per hour worked).
According to the Congressional Budget Office, the workforce should grow at a rate of 0.3 percent to 0.4 percent each year this decade, compared to the annual rate of 0.8 percent from 2000 to 2020. We get a 2 percent trend for real GDP growth by adding 1.6 percent from productivity gains. That’s 4.5 percent nominal growth assuming core PCE inflation settles at 2.5 percent.
Nominal growth was around 2 percent higher than the 10-year yield on average in the ten years running up to 2019. The 10-year yield should not exceed 2.5 percent during this cycle if this pattern continues, and there’s no reason to expect it won’t.
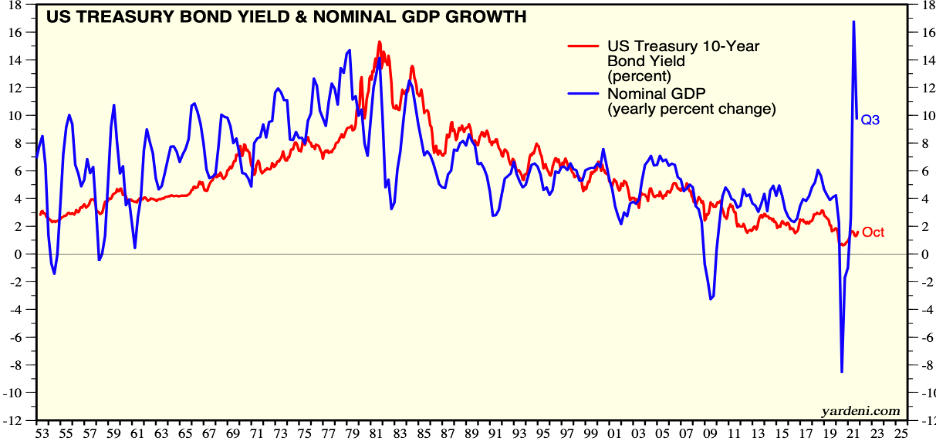
Source: Yardeni Research
Reviewing past monetary-tightening regimes, we observe that the 10-year Treasury yield and the Fed funds rate have peaked around the same level. In 1989 the 10-year yield was constrained by a funds rate near 9 percent. In 2000 the 10-year yield and the funds rate peaked at 6.5 percent. In 2006 both topped together at around 5 percent.
The exception was in 1994 when bond yields spiked higher in response to the Fed’s shock tightening. Then Fed chief Alan Greenspan doubled the funds rate from 3 percent to 6 percent in a year’s time, a move that was not built into market expectations.
Based on forecasts from FOMC members, the long-run estimate for the funds rate in 2018 was 3 percent. This capped the 10-year yield at 3.25 percent. The median projection of the long-run fed funds rate—essentially, an estimate of the neutral rate—has declined over time. It is now 2.5 percent. If history repeats itself, the 10-year yield is expected to move in that direction.
The 2.5-level on the 10-year is especially significant given that the monthly chart’s sliding 200-day moving average is also approaching that level. Each brush with it has resulted in a market riot: the 1987 Black Monday stock market crash, the 1990 savings and loan crisis, the 1994 Tequila Crisis, the 2000 dotcom bust, the 2007 Great Recession, as well as the fourth quarter of 2018, which was the worst quarter for the S&P 500 since 2008.
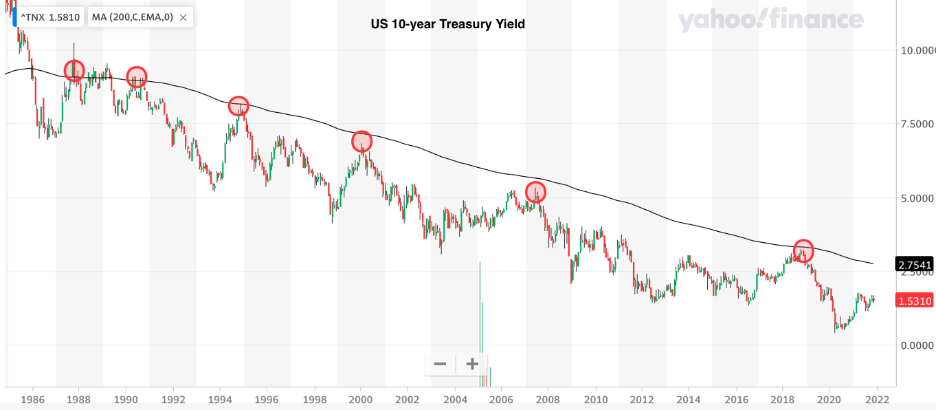
Source: Yahoo Finance
We love pushing through confusion and complexity, emerging with a clear mind and a far more complete and comprehensive understanding.
As such, we’ve obtained clarity—a wide gap between bond yields and inflation/nominal growth is common—conviction—bond yields will remain below nominal growth—and a sense of calm—acknowledging the bull market may continue until the 10-year yield gets closer to 2.5 percent.