In London this month, we carried on the tradition of The Most Interesting Dinner in The World. We gathered an eclectic group of people at Ruya, a stylish Mayfair eatery serving modern Anatolian cuisine.
As is customary at our dinners, each attendee was requested to bring a chart to discuss with the group. Please find a summary of the charts and discussion below.
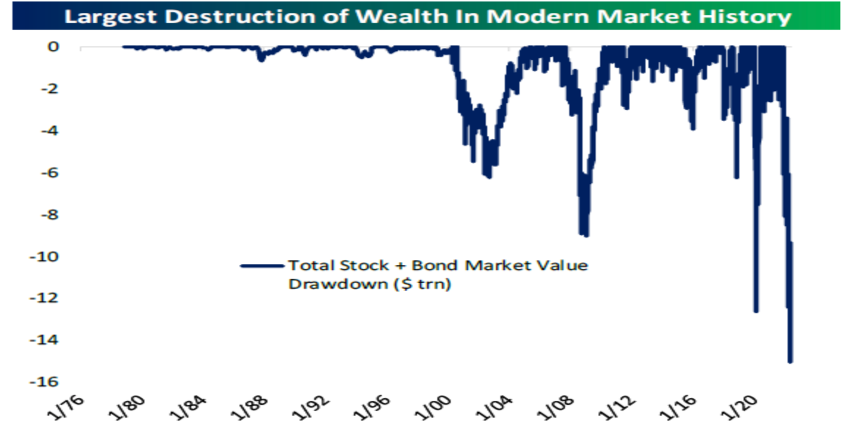
Chart 1: Short Richistan A wealth-induced swing in aggregate demand could be sufficient to push a vulnerable US economy into recession.
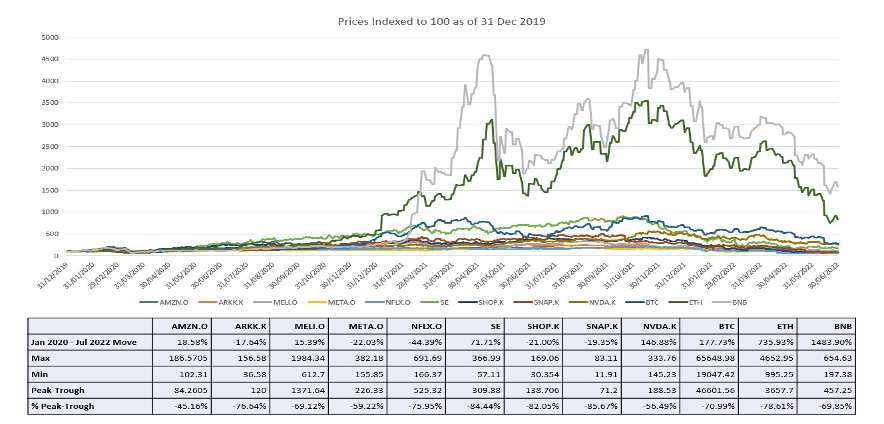
Chart 2: Long Experiments The past few weeks have been eventful for the crypto industry. Such contagion is common toward the end of financial panics.
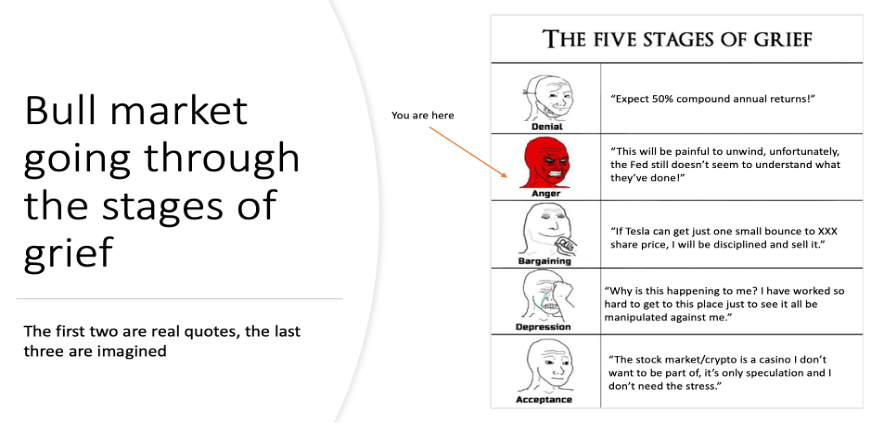
Chart 3: Long Grief “No one makes money in the anger phase. Shorts go up, longs go down.”
Chart 4: Short Chimerica There are encouraging signs of a “socialism put” with the stimulus tap being opened once more.
Chart 5: Short Patagonia VCs are the dumb money.
Chart 6: Long Puzzles “Previous credit default cycles have had similar set-ups to what we are seeing today.”
Chart 7: Long Bushido As the largest creditor nation, Japan’s outbound capital flows have had a able impact on global markets. What if the carry trade reverses?
Chart 8: Short Priors Surprise is a key factor in markets, and as the foundation of the international rules-based system is shifting, we should be more aware of it.
Chart 9: Long Kingdom Investors must learn to not let their political views color their investment views. Saudi Arabia is the world’s least crowded trade.
Chart 10: Long Supplication “If everyone at the table prays for you, what should we pray for?”
Short Richistan
Source: Bespoke
The St. Louis Federal Reserve estimates that rising equity and property prices contributed significantly to the growth in household wealth from $116 trillion at the end of 2019 to $149 trillion at the end of 2021. This suggests that household wealth surged by around $33 trillion, or more than 150 percent of GDP, over a two-year period.
With global stocks and bonds suffering their worst first-half performance in more than fifty years, we are now witnessing an unusually large destruction of wealth.
“Given household wealth is a major factor in consumer expenditures,” the speaker argued, “such a wealth-induced swing in aggregate demand could be sufficient to push a vulnerable US economy into recession.”
The prospect of a recession is especially troubling since it may trigger another leg down in the stock market. That, in turn, could further constrain aggregate demand through the wealth effect, which would cause the economy to enter a deeper recession.
One of the attendees was more sanguine. “Declines in markets haven’t hurt household’s net worth accumulated during the pandemic,” he said.
At the end of March, households had $18.5 trillion socked away in deposit, savings and money-market accounts, more than $5 trillion above what they had heading into the pandemic, according to Federal Reserve data. Net worth—assets such as homes and stocks minus debts—was eight times disposable income, greater than 6.7 at the height of the 2000s housing boom and 6.2 during the 1990s tech bubble. The average ratio of household wealth to disposable income in the US was about 4.5 from 1970 to 1995.
During the global financial crisis, total losses amounted to $10.2 trillion, with US stocks losing $6.9 trillion and housing equity down $3.3 trillion. That was 69 percent of GDP at the time.
While total losses amount to nearly $12 trillion in 2022, with $9.3 trillion wiped of US stocks and $2.6 trillion from bonds, this amount is less than the $18 trillion increase in household wealth created in 2021 and represents 56 percent of GDP.
“Households are relatively wealthy and ready to spend, while the job market continues to hum month after month. Recession risks are minimal,” he continued.
“Where does one hide in this environment?” asked a participant.
A systemic manager shared that the macro backdrop is benefiting uncorrelated strategies like CTAs or commodity trading advisors. The SG Trend Index, which tracks the return for a pool of CTAs is up 25 percent this year (the best performance for the period since 2000 when BarclayHedge started recording such data).
A family office investor focused on generational wealth building suggested looking past the current volatility. “Time will bail you out,” he concluded, speaking from experience.
Long Experiments
Source: Refinitiv Eikon, Coingecko
It’s a scam, it’s all a Ponzi, it’s at best a failed experiment, and (perhaps ironically) “have fun staying poor” are among the most jeering comments made to the crypto community in recent weeks.
So the speaker mapped the performance of some of tech’s greatest champions against the few crypto securities which have been around for long enough to warrant comparison. He picked Bitcoin, Ether and Binance Coin (BNB) to juxtapose against Amazon, ARKK, MercadoLibre, Meta, Netflix, Sea, Shopify, Snap and Nvidia.
The results are interesting to say the least. BNB, for example, has outperformed some of the tech darlings from peak to trough (and even over the period from January 2020 till today).
“Failed experiment? Doesn’t look like that big a failure once put in context with everything else,” said the speaker.
It’s been an eventful year for the crypto industry: The TerraLuna collapse, major crypto lenders freezing withdrawals; hedge fund Three Arrows Capital being liquidated; Celsius Network bankruptcy: Sam Bankman-Fried, the CEO of FTX, buying BlockFi in a firesale (for up to $250 million versus its $3 billion valuation last year); the European Union finalizing sweeping rules to “put an end to the crypto wild west”; and the US Department of Justice cracking down on cryptocurrency-related fraud.
“Such contagion is common toward the end of financial panics,” shared an attendee. He was surprised that, despite all the bad news, Bitcoin is still more than double its pre-pandemic level and hovering around $20,000 (the all-time high from its previous bull run).
While crypto trades like growth tech for the time being, the speaker views it as an “escape valve” from the incumbent financial system, by enabling the creation of self-sovereign money in an alternative system.
“This bear market should be taken as an opportunity to build,” he continued. “Just like the internet and the dot com boom/bust in the early 2000s, the minimum viable product has been delivered. Product-market fit might not yet be completely clear, but if the building continues, it is almost inevitable that the right products will come along to fit market demand.”
His advice: It is in the shakeout, amidst all the indiscriminate selling, that we find the best opportunities to purchase the most promising assets.
Long Grief
Source: Google
Bear-market psychology follows a progression that is similar to what psychologists call the five stages of grief—denial, anger, bargaining, depression, and acceptance. Here’s how they manifest in the stock market:Denial: In this initial stage, the prevailing view is that stock-market weakness is nothing more than a buying opportunity. Investors are more focused on bottom-fishing than worried about the possibility of further, steep declines. In a clear sign of denial, Cathie Wood told her devoted fan base in April to expect “50 percent compound annual returns.”
Anger: Denial becomes increasingly difficult to sustain as the market’s pullback becomes severe. Many investors get angry as they rail against the unfairness of the pullback. Others deflect blame onto the Fed for causing their mishap.
Bargaining: In this stage, investors start hoping for just one more rally to get out at even or make back some of their losses. They promise to stick to a process or be more disciplined.
Depression: As the market continues to slide, the realization sets in that things won’t be the same again. Many worry about the impact on their lifestyles given the hit to their portfolio.
Acceptance: In this final stage, investors throw in the towel. They surrender to the bear market and stop even fantasizing about when it might end. They vow not to participate again. There’s general apathy and indifference.
“The bear market for stocks isn’t over,” said the speaker. “In fact, it may have aways to go. We’re still in the anger stage.”
“It's quarter end, stocks should rally! Why is oil going down? Why is the crappiest credit rallying? So much anger! Across risk assets, the starting point of volatility has made hedging useless,” he added.
So far, the stock market’s rally since June 16 has been led by the biggest losers during the bear market. That’s homebuilding, along with consumer discretionary and tech. The worst performers are energy and commodity miners. “No one makes money in the anger phase,” the speaker continued. “Shorts go up, longs go down.”
An attendee stated that whereas policymakers were previously in denial about inflation, they now appear to have hastily accepted it. They are committed to the inflation-fight and the market regards them as credible. The corollary is that being more hawkish is not necessarily bad for markets.
“There’s also anger in the streets,” shared a participant. “Costly food and energy are fostering global unrest.” Inflation protests now span Sri Lanka, Kenya, Ghana, Panama, Argentina, Ecuador, Peru, Albania, Pakistan, and the Netherlands. “Many governments are too indebted to cushion the blow to living standards. Things may get a lot worse.”
Short Chimerica
Source: Bloomberg
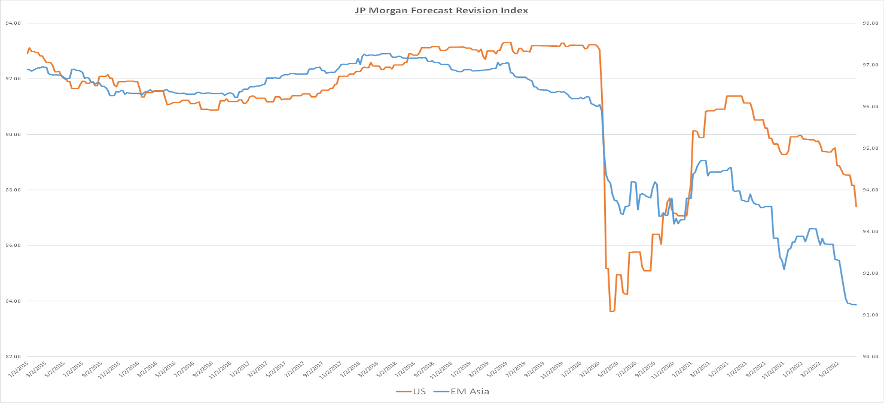
The US and China are the two main engines of global growth. Based on how they are doing economically, the speaker offers a simple framework for investing:
1. Both growing strong: sell bonds
2. Both weak: buy bonds
3. US strong/China weak: buy USD and sell EM
4. US weak/China strong: sell USD and buy EM
According to the speaker, we are entering the second quadrant. His chart shows US growth is now catching down with emerging Asia’s weaker forecast revisions. He’s bullish on bonds.
Regarding the dollar, the group’s opinions were varied. An attendee shared that the decade-long dollar bull market may come to an end once China’s economy stabilizes. There are encouraging signs of a “socialism put” with the stimulus tap being opened once more.
Another participant saw the euro sliding to 90 US cents by the end of the year. “Contrary to popular belief, the US economy is more robust and can withstand higher interest rates,” he said, “whereas Europe faces a perfect storm.”
The current energy crisis and potential recession would make it harder for the European Central Bank to tighten monetary policy, and likely widen the interest-rate differential with the US.
Short Patagonia
Source: Federal Reserve Bank of San Francisco
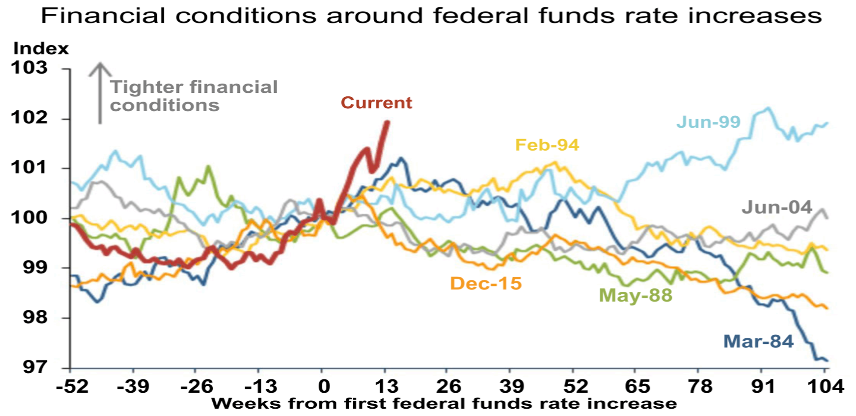
The speaker’s chart shows that financial conditions and real activity are adjusting to expected monetary policy tightening at a faster rate than prior cycles, even when actual rates have not fully risen. This implies that (i) monetary policy may be tighter than the actual level of the fed funds rate would suggest, and (ii) long and variable lags to the real economy may not be as long, or variable, as typically assumed.
As financial conditions have tightened, some leading indicators of economic activity have softened, especially in interest-sensitive sectors, such as housing. And consumers have expressed caution more broadly, recognizing the impact of expected higher rates on their future borrowing prospects.
The Fed funds rate is expected to reach a high of 3.5 to 3.75 percent in the first half of 2023, after which the market is pricing 75 basis points of rate cuts. Despite high inflation, the hiking cycle is projected to last about twelve months, which is generally shorter than anything we have ever seen.
“The implication is either inflation is about to roll over quickly or we are going to see a recession in the next year,” said the speaker, a macro investor turned venture capitalist. “Which is it?”
He noted that VCs are concerned about inflation and think higher interest rates pose headwinds for risk assets. They also seem to be sure that a recession is here, which warrants lower interest rates. Those are conflicting beliefs on the future course of interest rates.
“VCs are watching the market tape, studying the inflation reports, listening to Fed commentary,” the speaker continued. “However, as newly minted macro experts, they’re yet to turn their attention to EDZ2-EDZ3. Once they notice the interest rate cuts priced for next year, they may reevaluate their bearishness.”
The speaker is warming up to the bullish side of the market, front-running his VC peers, whom he derides as “dumb money.”
Long Puzzles
Source: J. P. Morgan
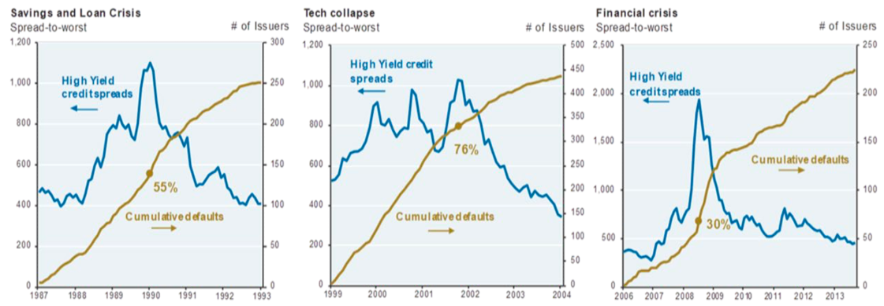
Over $5 trillion worth of leveraged corporate debt is outstanding in the US now, more than twice as much as there was before the 2007 global financial crisis (GFC). High yield bonds, leveraged loans, and direct lending all fall under this category.
There’s also a record percentage of lower-rated debt. Over two-thirds of all loans are rated B+ or lower compared to only one-third pre-GFC. (Single B loans are three-times as likely to default as BB loans). The decline in credit ratings is proof that issuer quality and credit worthiness have dramatically declined. More than one-third of all leveraged loans are now rated B- or CCC, which are at the highest risk of default.
“Previous credit default cycles had similar set-ups to what we are seeing today,” argued the speaker. “They all evolved in generally similar patterns and with similar results.”
Prior credit default cycles coincided with recessions and came after protracted periods of corporate leveraging and LBOs. Credit tightening and defaults typically push the economy into recession, which lowers earnings and lengthens default cycles.
Default cycles are long. They don’t end when recessions end. In fact, while the average length of the last three recessions was ten months, the average length of the last three credit default cycles was sixty-five months. In each of the previous three cycles, 25 percent of all high yield debt defaulted.
“Over $2 trillion of high yield bonds and loans come due over the next four years,” the speaker continued. “Restricted capital markets may prevent many levered borrowers from refinancing their debt.”
Global high yield bond issuance has fallen this year to the lowest since the GFC. US high yield issuers have raised just $50 billion, a 78 percent drop over the same period last year. European junk bond issuance has also declined by about 70 percent. Yet, the default rate for US and European high yield debt remains historically low at 0.6 percent and 0.3 percent respectively, despite deteriorating capital market conditions.
While the speaker expects a larger and longer default cycle this time, she admits that there are forces that may prevent this from happening. There’s lots of cash or “dry powder” among private equity sponsors and opportunistic investors. Covenant-lite loans also place fewer restrictions on a borrower and may lead to fewer companies defaulting.
Nearly 90 percent of the $1.3 trillion in outstanding US leveraged loans are covenant-lite, having lost the usual lender safeguards. In 2000, covenant-lite loans represented only 1 percent of the market.
“The market is pricing in a default rate of less than 3 percent on a one-year horizon and over 35 percent on a five-year horizon,” observed an attendee. “That offers an interesting opportunity in the iTraxx European Crossover index.” He believes defaults will either be front-loaded, exceeding 3 percent in quick succession, or much lower than 35 percent over the long-term.
Long Bushido
Source: Bloomberg
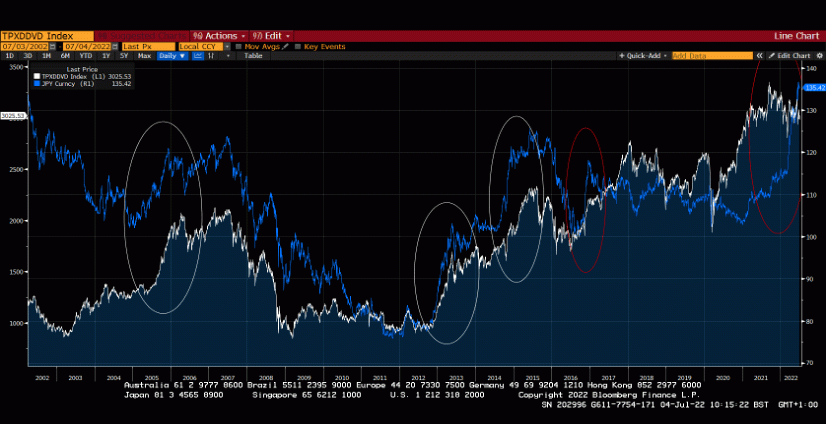
In September 2016, the Bank of Japan adopted a new strategy to boost the flagging Japanese economy: “yield curve control,” or YCC. The BoJ’s pledge to hold 10-year JGB rates at zero pushed domestic investors to find yield outside Japan. Retail investors piled into the “carry trade” after realizing they could earn higher returns by investing abroad.
While global central banks have raised interest rates to tame inflation, the Bank of Japan has stuck to its ultra-loose monetary policy and pledged to keep bond yields pinned below 25 basis points. The yen has fallen 20 percent against the US dollar this year as a result of the widening policy gap, reaching a 24-year low.
During one week in June, the BoJ spent $72 billion buying bonds, almost what the Fed and ECB were doing in an entire month last year. Adjusted for the different sizes of their respective economies, such pace of Japanese QE is more than 20 times the pace of the Fed’s in 2021.
“This is not sustainable,” said the speaker. He is worried about the market ramifications if the BoJ scraps its YCC policy. “What if we see a reversal of the carry trade?”
As the largest creditor nation, Japan’s outbound capital flows have had a sizeable impact on global markets. Japanese investors are the second largest holders of foreign bonds in the world after the US.
“If Japanese institutional and retail investors bring capital home to invest in their own markets,” shared a participant, “there could be further upward pressure on bond yields in the US, Europe and Asia.” Japanese investors were net sellers of foreign bonds for the third consecutive month in May.
The hedged US 10-year yield is now below the Japanese 10-year yield, while hedged euro yields have increased. If demand for euro bonds increases at the expense of demand for dollar bonds, this could be supportive for the euro.
An attended suggested a long position in Japan’s credit default swaps (CDS) as a hedge against an abrupt policy shock. Japan’s CDS, which traditionally has seen tighter spreads than the US or European counterparts, is trading wider and does not look to be narrowing soon.
Short Priors
Source: Bloomberg
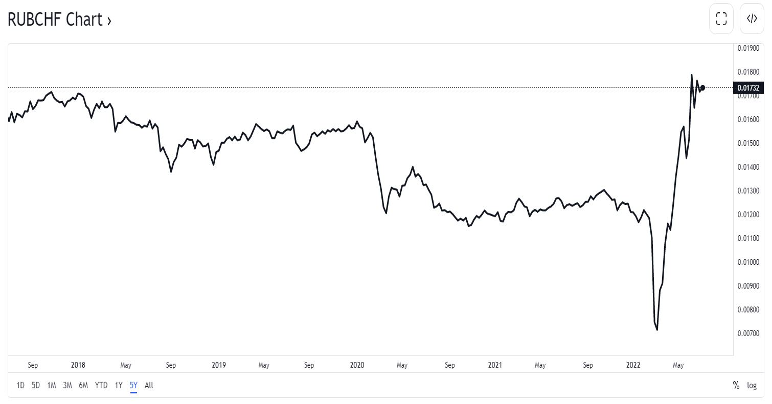
“If you had known that Russia would attack Ukraine and about the harsh sanctions put in place by the West, would you have predicted the ruble would trade as it has?” asked the speaker. “Absolutely not.”
Since the invasion, the ruble has increased by 31 percent against the US dollar and by 70 percent against the haven Swiss franc. This serves as a reminder to the speaker to “forget all priors” and always approach markets with a “strong dose of humility.”
“Surprise is a key factor in markets,” he reflected, “and as the foundation of the international rules-based system is shifting, we should be more aware of it.”
Long Kingdom
Source: Ipsos
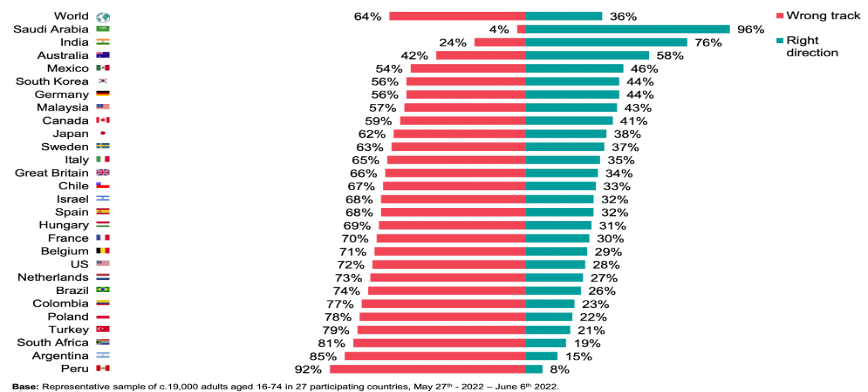
In the twenty-seven countries polled, the speakers’ chart reveals that, on average, 64 percent of respondents believe their country is headed in the wrong path while just 36 percent believe they are on the right track.
Saudi Arabia has the highest share of respondents who believe that their country is moving in the right direction, at 96 percent. In another survey question, 97 percent of Saudis describe the current economic situation as “good,” compared to 34 percent on average across the other nations.
“The social and cultural reforms have occurred at a much faster pace than expected,” said the speaker, “and that makes it easier for the leadership to carry out the necessary economic reforms.”
“In a world grappling with political polarization, financial repression, and inflation, Saudi Arabia (and the rest of the Gulf countries) stand out as positive anomalies,” he continued. “These markets should not be ignored.”
Since the pandemic lows, the Saudi Tadawul Index has gained 96 precent, compared to 62 precent for the S&P 500 and 38 percent for MSCI Emerging Markets. “The stages of grief don’t apply to me,” the speaker remarked, who stewards capital on behalf of Saudi Arabia’s largest pension fund.
Everywhere liquidity is tightening. Except Saudi, which earns around $8 billion every month from oil sales. There’s no currency risk, while the budget will swing into a surplus this year—its first surplus since it went into a deficit after oil prices crashed in 2014.
Foreign ownership in Tadawul is still less than 5 percent, compared to about 50 percent in Mexico and nearly 60 percent in Turkey. Nearly two-thirds of EM managers have never invested in Saudi Arabia, which has a 2.8 percent weighting in the MSCI index.
“Given the Kingdom’s massive outperformance,” he added, “this is not only the world’s least crowded trade, but also the pain trade. Investors must learn to not let their political views color their investment views.”
Long Supplication
Source: IMDB
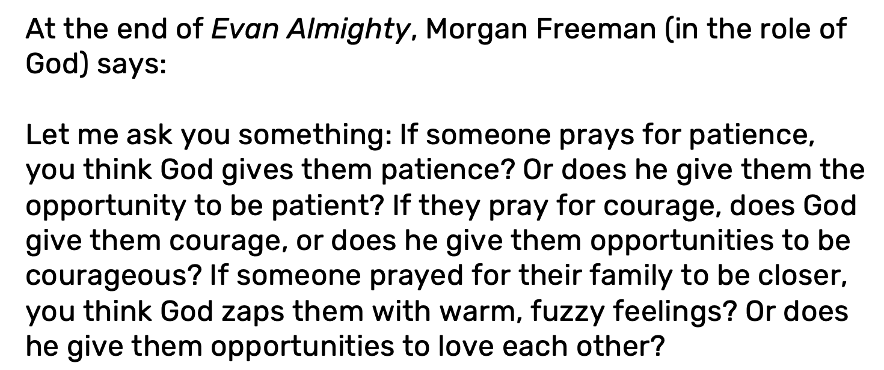
The speaker asked, “If everyone at the table prays for you, what should we pray for?” He went first.
“There are four things we need to do with our children: get them dressed, feed them, wash them, and put them to bed. Each of these basic duties has been taking an hour for our eldest daughter, who is seven years old.
“Eighteen months ago, in the middle of the pandemic, we moved to Canada after years of living in Dubai with my parents. I made the mistaken assumption that the relocation wouldn’t affect my girls since they are too young. I was so caught up in the logistics of it that it didn’t even occur to me to talk them through the transition.
“While my daughter whined and seemed unhappy at times in our new home, there weren’t any behavioral issues. But this year, after a winter vacation in Dubai, the issues started manifesting.
“She complained about her breathing, struggled to fall asleep, began to imagine awful things happening, and developed a variety of irrational fears, such as going to the bathroom, her clothes, and the floors she walked on.
“At first, my wife assumed she was acting like a spoiled child. This strained our relationship because I saw the problems more deeply rooted, and we could not agree on a way forward. ‘Our daughter is not deliberately trying to be difficult; she is suffering.’ I kept saying. ‘For her to change, we must change.’”
While we may think that we are the ones who raise our children, in reality it is our kids that mould us into the parents we need to be. They contribute to our growth in ways that may be more profound than we can ever contribute to theirs.
“Once my wife and I got on the same page, we were able to work on helping her. We realized that our daughter had developed major anxiety. She was deeply attached to her childhood home and the move was tough on her beyond measure.
“I’ve been reading a range of parenting books throughout this period to help me deal with the situation. Working with a parenting coach, adopting the hand-in-hand parenting style, utilizing MNRI touch therapy, and undergoing cognitive behavioral therapy have all proved helpful. While there has been a lot of improvement, we realize that this will require ongoing care.
“This has been the most difficult year for us at home. Please pray for my daughter.”
After a brief silence, all eyes turned on the person seated to the right of the speaker.
“My father was ruthless,” said the attendee. “Pray for me not to become my father.” As the doting parent to two young kids, he still struggles with issues from his childhood.
The next participant expressed concern about the way his wife handled their small children. “My older kids (from my first marriage) show more patience and compassion than her,” he said. “Please ask God to help my wife be more understanding and forgiving.”
“I had a major health scare earlier which transformed my life,” said another attendee. “I’m perfectly healthy now but please pray for my continuous health.”
The person sitting beside him said, “I met one of my lifelong friends before coming to this dinner. He told me that he’s very seriously ill. Everybody, please pray for him.”
Next up was someone who had come from humble beginnings and reached the highest echelons of investing. He felt fortunate to be able to “pursue his calling” and only desired to be a “vessel” for good works. “With great blessing, comes a lot of responsibility,” he remarked, getting choked up. “Ask God to help me live up to all that is expected of me.”
“I discovered the practice of gratitude journaling after a challenging year,” an attendee said, as we continued around the table. “This enables one to persevere while moving through the five stages of grief.”
“No matter what loss you have suffered, what wrongs someone has done to you, or what sorrow you have inflicted upon on yourself,” she continued, “your struggles become part of you—and you can find a way to be grateful for them. Pray that I’m always grounded in gratitude and appreciation.”
“Our industry is brutal,” shared a trader at the prime of his career. “The P&L is the most important thing. That’s all we focus on. The fact is that, despite our fixation on the macro world, my mother is my world. She is now fighting cancer. Please pray for her.”
“At first, I was going to give some platitudes, but I’m inspired to put the BS behind me,” another attendee said. He placed his hand on the shoulder of the person seated next to him, “I’m in the same camp as you. My mother also has cancer. Next week, she is going on another very tough chemo treatment. I’m worried about her. Please remember her in your prayers too.”
He acknowledged that the situation had caused him to become more detached from his P&L; hence, gaining or losing money no longer affected him as much as it formerly had. This has helped him make better trading decisions.
“Listening to everyone,” shared the final participant, “I see how each of us is walking his or her own path. It’s not easy; there’s a lot going on beneath the surface. Pray that we all have the strength and courage to put our best feet forward.”


