The primary human emotion in a stock market crash is fear. But it’s not the fear of the unknown. We cannot fear something that we do not know. What we really fear, in fact, is the loss of the known. Coronavirus has undermined our most basic ideas about everyday life, movement, and work. That’s what we fear.
As investors, what we have known is a long period of calm, prompting us to keep buying the dip, keep chasing yield, and not think the unthinkable. The reason we are seeing such wild swings is that we are afraid coronavirus has changed markets as we have known them. This is not uncharted territory, but rather an unfamiliar one.
We turned to history to get acquainted to previous stock market crashes and found that Elliott Wave Theory, developed by Ralph Nelson Elliott after experiencing personal losses in the 1929 stock market crash, is particularly helpful in our analysis. The theory states that collective investor psychology, moves between optimism and pessimism in natural sequences that repeat over and over again. These movements are called waves.
In wave A of a bear market, most people see the drop as a correction in a still ongoing bull market. Some technical indicators that accompany wave A include increased volume and volatility. Prices reverse higher in wave B, which many see as a resumption of the now long-gone bull market. There is false optimism and volume during wave B is lower than in wave A. Prices move impulsively lower in five waves in the final corrective wave C. It is during this decline that illusions held throughout waves A and B tend to evaporate. Many believe prices will never recover and that a bear market is now firmly entrenched.
1929-32: The A wave crash in 1929 lasted 11 weeks. The Dow declined 50 percent. Wave B rose 50 percent over 6 months and retraced 50 percent of the wave A decline. Then wave C was agonizingly drawn out, with an 84 percent drop by 1932.
1937-42: The A wave crash in 1937 lasted 12 months. The Dow again fell nearly 50 percent. Wave B rose 60 percent over 9 months and hit the key 61.8 percent Fibonacci retracement level. Then a complex wave C decline ensued over 4 years with a steep drop to a new low in April 1942.
1946-49: The A wave crash in 1946 lasted 22 weeks and the Dow fell 25 percent. Wave B rose 18 percent in a choppy upslope and retraced 61.8 percent of the decline over 15 months. Then wave C declined 15 percent to a marginal new low in June 1949.
There were other stock market crashes (1961, 1966, 1987, and 1998) that fully retraced the decline over a span of a few months to a few years, but as they did not coincide with a recession, we see them as less useful templates.
As can be seen in the chart below, each wave A crash created “gaps” along the way, most of which were subsequently “filled” during the retracement. Gaps are areas on a chart where the price moves sharply up or down, with little or no trading in between. A breakaway gap to the downside is a sure sign of weakness.
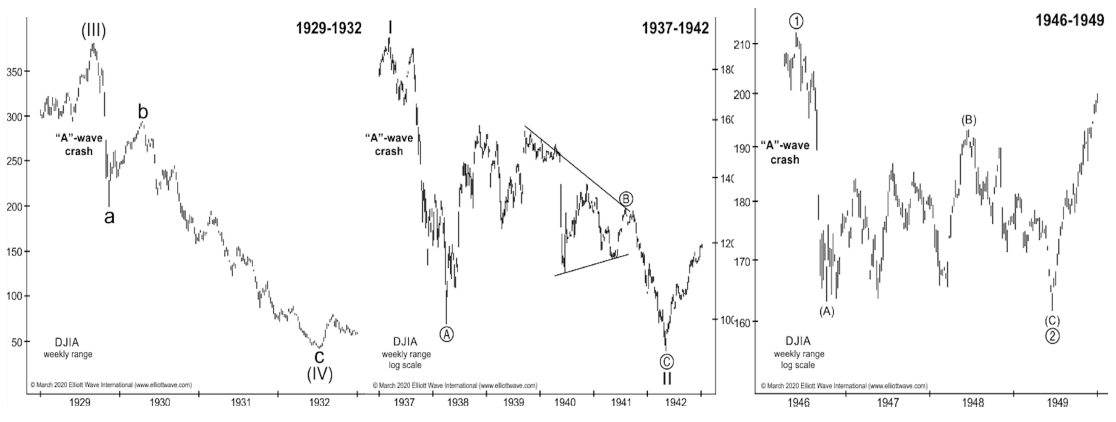
Source: Elliott Wave International
Based on the historical perspective, we can elucidate the path forward for markets from here.
The S&P 500 peaked on February 12 and created a breakaway gap to the downside on February 24. That should have put us on high alert. There was a massive spike in trading volume and more continuation gaps followed as so much of the known world changed with the global spread of Covid-19.
The A wave crash seems interminable, but we believe the decline has ended abruptly around last week’s lows, a swift 33 percent fall in just 5 weeks. The Dow declined 36 percent and Russell 2000 fell 44 percent.
What comes next is an explosive rise in wave B that should retrace 50 percent (2835) or 61.8 percent (2960) of the steep drop. These upside levels coincide with gaps on March 9 (2863) and February 27 (3062), which may be filled on the way up; and the downward sloping 200-day moving average (3025) and 2019 highs (3025) which now act as resistance.
In the coming weeks, the fastest bear market in history could give way to the fastest bull market in history (the benchmark index rises 20 percent off its low). Many will see this as a resumption of the secular bull market that began in 2009. However, as we opined in January, we think the S&P 500 may not surpass its 2020 highs for several years.
The extreme valuations at the start of this year and the inestimable impact from the coronavirus makes it more likely that we see a complex wave C in the third leg of the bear market. We are surprised to see Nasdaq’s relative strength during this selloff and expect tech to lead the way to the downside in the final correction to new lows.
We can evaluate again at the top of wave B, which we expect to reach above 3,000 on the S&P 500 in the next 3 to 6 months. Below are some more wave B targets for markets around the world.
Be willing to take a chance.
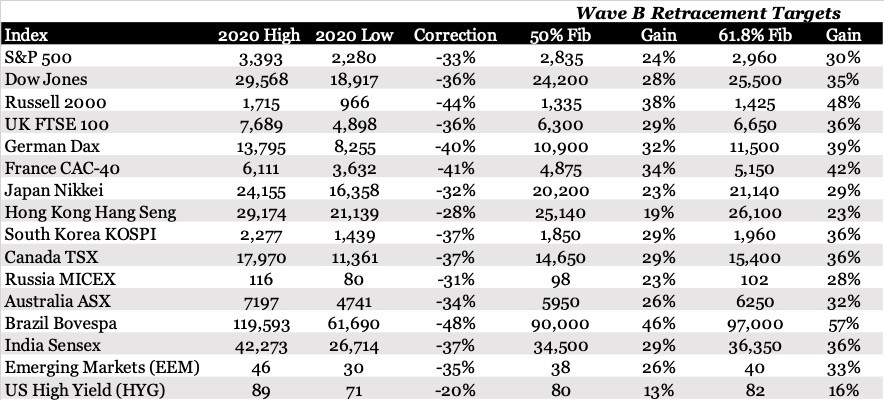

Photo: Pexels