The chart shows the breakdown of the global fixed income market by a few groupings of yields. In 2000 and 2007, over 75 percent of the fixed income market yielded 3+ percent and 25 percent yielded 0 to 3 percent. But everything changed after the 2008 financial crisis.
As central banks experimented with unorthodox policies (ZIRP, QE, negative rates), yields became scarce. By 2010, 3+ percent yields made up only 25 of fixed income investments. While there were tiny outcroppings of negative yield from 2010 to 2015, 75 percent of the market was made up of “0 to 3 percent” yields.
The real change happened about 5 years ago as commodity prices crashed, renewing deflationary concerns. Negative yielding bonds surged to nearly a quarter of the global fixed income market. There are still $12.3 trillion bonds with sub-zero yields out of $70 trillion in government bonds globally.
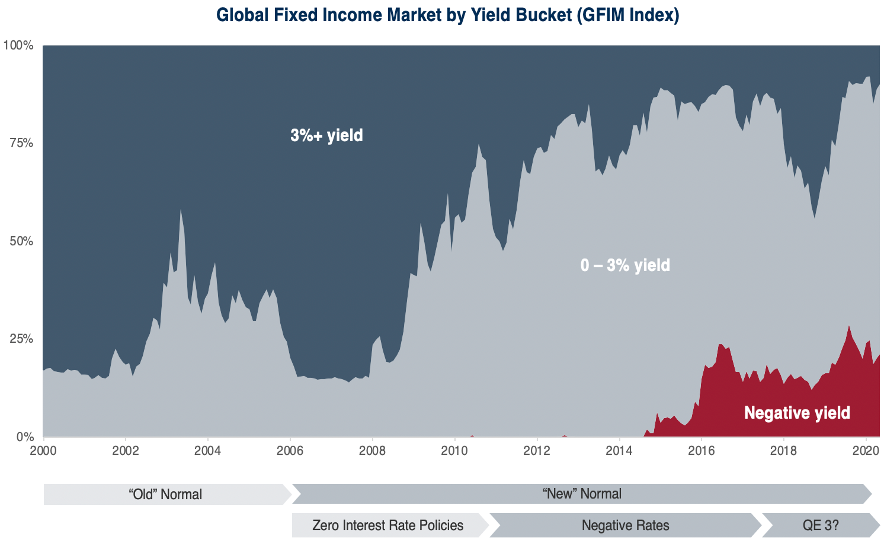
Source: Algebris Investments
Long-dated bonds have produced double digit returns in 2020 but the pandemic-driven surge is not repeatable. Only 10 percent of global fixed income yields over 3 percent.
“Investors in government bonds are a boiling frog,” said Alberto Gallo, Head of Macro Strategies at Algebris Investments in London. He is concerned inflation is going to turn upside-down the remaining fixed income assets with positive real yields. This may happen orderly, with bondholders accepting yields well below inflation, or disorderly. In the first case, fixed income investors will lose money slowly. In the second, they will lose it faster.
“The most dangerous asset you can have in a portfolio is the 30-year Treasury… but so far, no one is worried because the last 10 years of QE didn’t create inflation. But what if there is actually a change in monetary regime?”
Today’s monetary and fiscal stimulus is unprecedented in and scope—and governments are taking control of money supply. This brings him to a few conclusions:
(1) Central banks are likely to stay locked into stimulus for a long time, long beyond the official conclusion dates of their asset purchase programmes.
(2) Governments will continue producing large fiscal deficits and debt will have to be monetized.
(3) New stimulus will be increasingly bottom-up, aimed at individuals and SMEs rather than large firms. This means spending is going to economic agents with more propensity to spend—and to vote, making it politically harder to withdraw it.
(4) Inflation is firstly a social and political act, before a monetary phenomenon. The rules of the game are changing and many of these shifts in policy will be permanent and have the potential to eventually cause a shift in inflation regime.
“If we get inflation,” said Gallo, “95 percent of the bond universe is going to give a negative return.” He continued, “The wipeout buffer, the amount of spread widening sovereign and investment grade bonds can withstand, is at record lows. For triple-B corporate bonds, only a 50 basis points widening in rates is enough to wipe out a year of carry.”
Gallo has increased allocation to inflation-linked debt, convertibles and maintains upside convexity in gold. He is also selling deep out-of-the-money credit puts.
Pandemics have a way of shifting the course of history, and not always in a manner immediately evident. Everyone agreed that we’ve crossed some chasm by directly giving money to people.
“It doesn’t really matter what you call it,” one of the participants said. “The government’s going to be in people’s lives for the next several years because while you have social distancing in place, you can’t really allow people to get back to normal. And if you don’t allow people to get back to normal, then you’ve got to help them out. It’s as simple as that.”
But this does not mean inflation is imminent. Commodity price inflation which may temporarily push CPI higher will be offset by less consumption due to economic insecurity. That means inflation could remain subdued around 2 percent over the next year.
“My guess is that will take a little longer than we think, but it probably starts happening sort of all at once,” said another participant who lives in California. Earlier he commented that the California wildfires used to come in September or October with the so-called Santa Ana winds. “But now we’re in August with the second worst fires in state history.”
It’s an interesting reminder from nature itself about expectations, cycle, timing and unexpected sharp changes. Nothing can happen for a long time and then all of a sudden, and at once, violent change arrives.
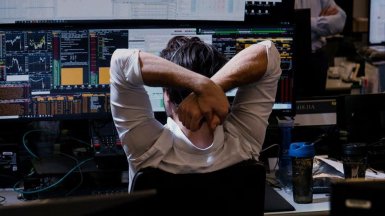
Source: Pexels