What if I told you the S&P 500 will reach new record highs in six months and continue rising for a few more years. Is that something you’d be interested in?
The secular cycles that the S&P 500 alternates between is driven by demographic shifts, technology, and significant changes to regulatory and monetary policy.
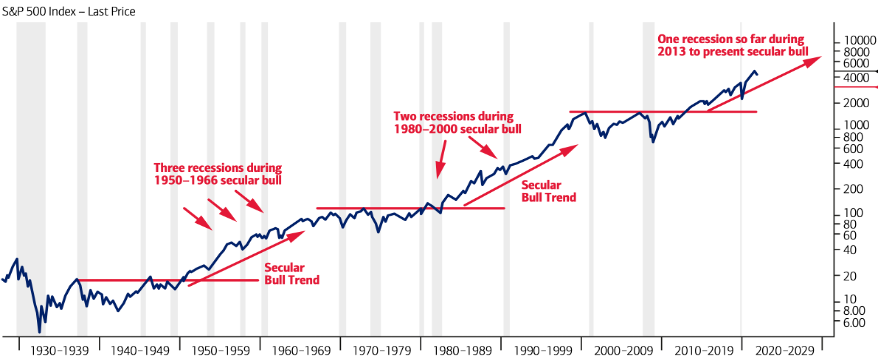
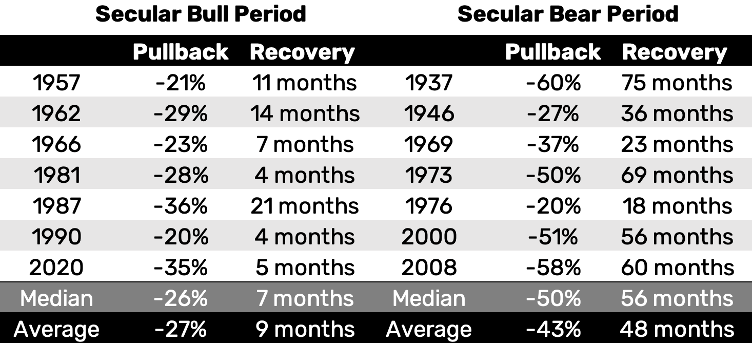
We think of a secular bull market as prolonged above-average returns; valuations expand, risk-taking looks attractive, and neither pullbacks nor recessions disrupt the upward trend. A secular bear market, on the other hand, is a prolonged period of below-average total returns during which valuations contract, drawdowns are severe, and recoveries from pullbacks can take a long time.
Source: BofA Global Research
Since the Second World War there have been three secular bull markets. The first one lasted from 1950 to 1968. It was brought about by the S&P 500 breaking out above the 20 level, which had served as a ceiling since 1937.
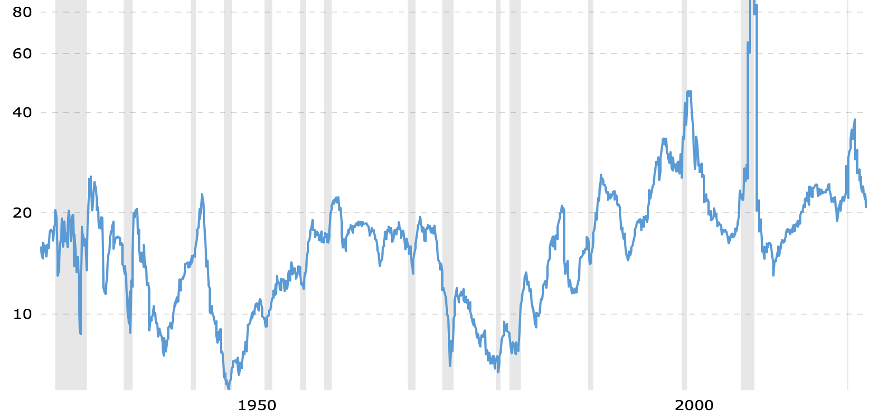
The S&P 500 gained 445 percent despite three recessions, the Korean War, the Cuban Missile Crisis, the assassination of President Kennedy, and the race riots of the 1960s. Bond yields rose the entire time. The 3-month Treasury rate increased from 1.2 percent in 1950 to 5.3 percent in 1968, while the 10-year yield went from 2.2 percent to 5.6 percent.
The stock market was unaffected by this. In fact, the 1950s was the best decade for stocks ever.
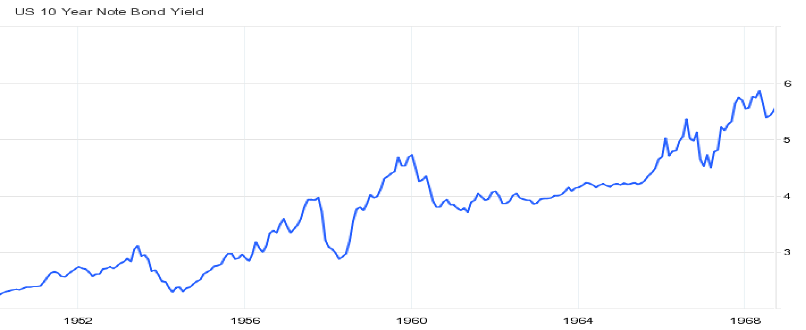
Source: Trading Economics
There were three intervening corrections of more than 20 percent between 1950 and 1968. The most well-known is the Kennedy bear market, which occurred between December 1961 and June 1962 and saw the S&P 500 plummet by 29 percent.
Investors bombarded the White House with complaints and pleas for help. Households slashed their purchases of stocks, while 8 percent of stockbrokers left the business in 1962. Oil tycoon J.P. Getty addressed the press: “When some folks see others selling, they automatically follow suit. I do the reverse—and buy. I don’t think the slide will go on.”
With the backing of successful investors, the public’s fears subsided. The S&P 500 recovered its prior peak fourteen months later and doubled over the next six years. It kissed 100 in 1968 but failed to pass it permanently until 1980—twelve frustrating years later.
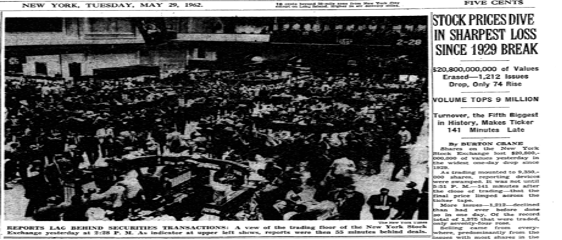
Source: The New York Times
The next secular bull market was 1980 to 2000. The S&P 500 increased by 1,400 percent despite two recessions, the stock market crash of 1987, the Japanese bubble bursting, the Savings and Loan crisis, the first Gulf War, the Asian financial crisis, and the Russian debt crisis.
Three corrections of more than 20 percent occurred throughout this period. The greatest was the 1987 crash, which saw the biggest single-day percentage decline in US stock market history.
Paul Tudor Jones, who profited on the day, said Wall Street was dealt a “life-threatening blow.” The S&P 500 had dropped by 35 percent in just two months. Many thought the crash was the start of another depression, including Jones who founded the Robin Hood Foundation because of his concern for the poor.
Stock prices began to rise again the next day, however, and the S&P 500 finished the year up 2 percent. It took nearly two years for the market to reach to its pre-Black Monday level, after which it kept rising for another eleven years.
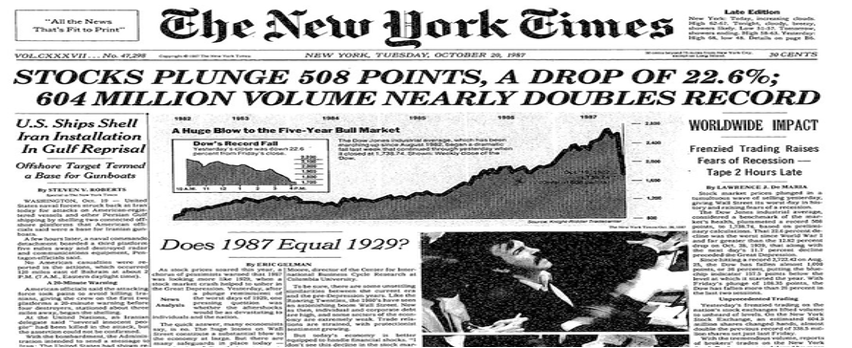
Source: The New York Times
Hitting 1,500 in the year 2000, the S&P 500 only managed to exceed this level thirteen years later in 2013. That’s when the third secular bull market in the postwar era began. Decisively breaking the confines of the post-2000 secular bear market, the S&P 500 has increased by 173 percent thus far despite a global pandemic, unacceptably high inflation, the Russian-Ukraine war, and Europe’s energy crisis.
There have already been two corrections of over 20 percent. The first, in early 2020, was pandemic-driven: in just sixteen trading days the S&P 500 tumbled 35 percent. This was the fastest bear market ever. Second quarter GDP plunged 32.9 percent, the worst ever, and unemployment rose to the highest level since the Great Depression. But then, contrary to everyone’s thinking, the stock market erased all its losses over the next five months.
This year, we witnessed another cyclical bear market inside a secular bull. We emphasize that such pullbacks have been less severe in terms of magnitude and duration than in secular bear periods.
Looking at past cyclical bear markets (a decline of 20 percent or more), the S&P 500 declined 27 percent on average in secular bull periods but fell 43 percent during secular bear periods. Whereas it took an average of 9 months to recover its previous highs during secular bull markets, the recovery took an average 48 months during secular bear markets.
Source: Bloomberg
This gives us confidence that the correction has ended with the low in mid-June, and we are quickly returning to the highs. Comparisons to the large bear market rallies in 2001 and 2008 are irrelevant because they occurred during a secular bear market. This secular bull cycle is still just two-thirds of the way done.
As for valuations, consider the secular bear market from 1937 to 1950 when the PE ratio dropped from 16.8 to 7.2. In the secular bull market that lasted until 1968, the PE reached as high as 22 in 1961 and was still 17.8 at the 1968 top before declining to 7.4 during the secular bear market that lasted until 1980.
The PE ratio increased to 32.5 by 2000 during the subsequent secular bull phase before falling to 14.8 in the post-2000 secular bear market. Now the PE ratio sits at 20.8 after peaking at 24.8 in 2020. Even if valuations may have reached their cycle top, it would be foolish to bet on a mean reversion during a secular bull market. Valuations may stay high for the remainder of this cycle.
Source: Macro Trends
Four primary forces drive the secular uptrend.
(1) strong household finances
The US household sector has delevered since the Great Recession and is arguably in its best shape in decades, with record high-net-worth levels and relatively low debt ratios. This boosts consumer spending power and makes the US economy far more resilient to higher interest rates. More than two-thirds of US economic activity is tied to household spending.
(2) favorable demographics
The previous major demographic impulse in the US was from the baby boomers, the oldest of whom turned 35 and entered prime earning age in 1981. Now the millennials constitute the generational impulse, turning 35 in 2016. They are now the largest generation in America, surpassing the baby boomers.
With an average net worth of $127,793 in the first quarter of 2022, millennials are twice as rich as they were before the pandemic. Boomers’ net worth (in 2022 dollars) was a comparable $136,786 in 1989 when they were the same age.
The shock of the pandemic compelled millennials to make financial preparations. They are emerging as a driving force in both housing and stock investing. Between 2016 and 2022, millennial homeownership has soared from 36 percent to 48 percent.
(3) unrestrained fiscal policy
We now live in a world where fiscal policy is unrestrained, starting with President Trump’s tax cuts in December 2017 and continuing with the emergency response measures during the pandemic (the most expensive economic relief effort in modern history), student debt-forgiveness, climate stimulus, and possibly energy price caps in the future.
The administration is reconsidering the social order and prioritizing human outcomes over budget outcomes. While there will be times when monetary policy counteracts fiscal support, the higher nominal growth environment of this cycle makes higher interest rates less of a strain. It would also likely reduce the fiscal burden thanks to an improved primary balance and denominator effects.
(4) higher productivity
The sheer scale of pandemic-driven changes to the workforce and to company business models argues for a large and long-lasting productivity inflection. Based on Carlota Perez’s model, we’re in the “technological deployment” phase and it will allow for annual productivity growth of about 1.8 percent this decade as opposed to the pitiful 0.8 percent rate during the last business cycle from 2010 to 2019.
Productivity gains will help offset the decline in labor supply experienced during the pandemic, in turn implying a longer runway for expansion. Rising productivity raises living standards, allowing wages and profits to rise at the same time. It also supports our forecast of a more normal inflation environment in the medium-term once pandemic dislocations recede.
A new era of productivity-led growth (similar to the early 1950s, 1960s, and late 1990s) would be positive for markets.
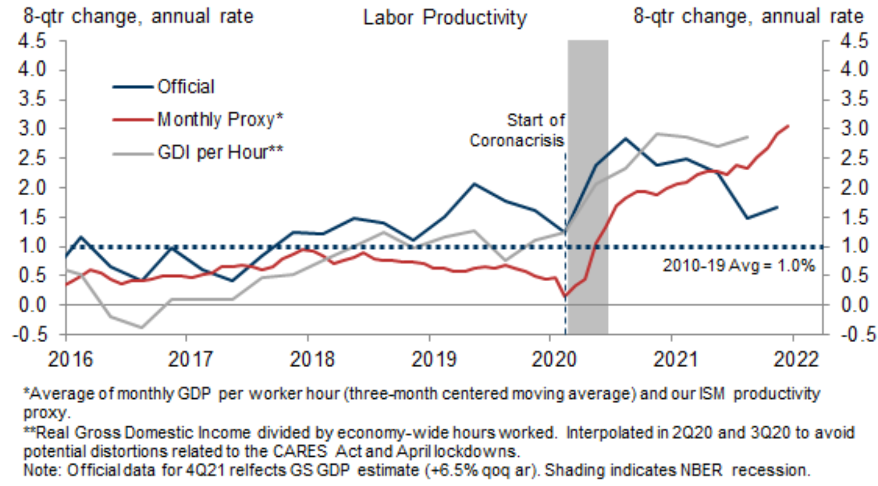
Source: Goldman Sachs
We get the same positive message looking at long-term charts.
Throughout this secular bull market, the Nasdaq Composite has continued to trade above its 50-period moving average (on a monthly chart). The index’s drawdown that took place this year ended precisely where you would expect it to.

Source: Barchart
Semis have the highest inventory build ever, memory chip prices are falling, and consumer demand for smartphones and personal computers is slowing, yet the Philadelphia Semiconductor Index, which tracks major global chipmakers like Intel, Qualcomm, ASML Holding, Nvidia and TSMC, remains in a secular uptrend. The chip boom is not over.
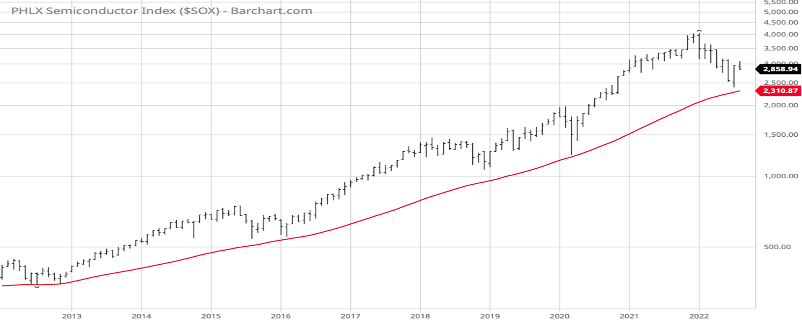
Source: Barchart
It took the financials sector fourteen years to finally break above the 2007 highs. This year the breakout level was successfully retested, and the uptrend has since resumed. The same is true for homebuilding stocks.
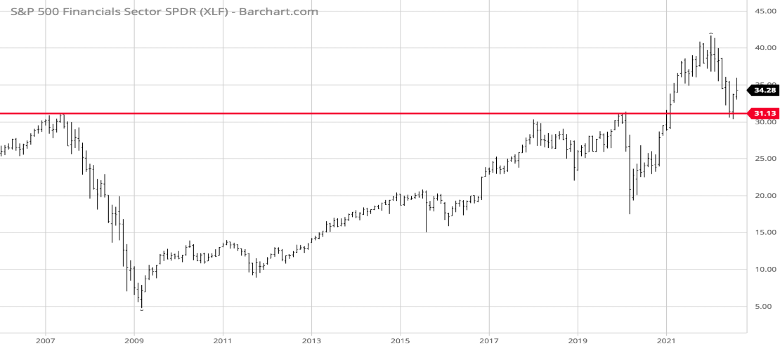
Source: Barchart
It’s not just an American story.
Japan’s Nikkei index crossed a 25-year resistance level in 2021, whereas the STOXX Europe 600 index convincingly broke above the 400-level, which had served as a ceiling since 2000. The breakout level was successfully tested again this year.
Zoom out. A secular bull market is in progress. Are you bullish enough?